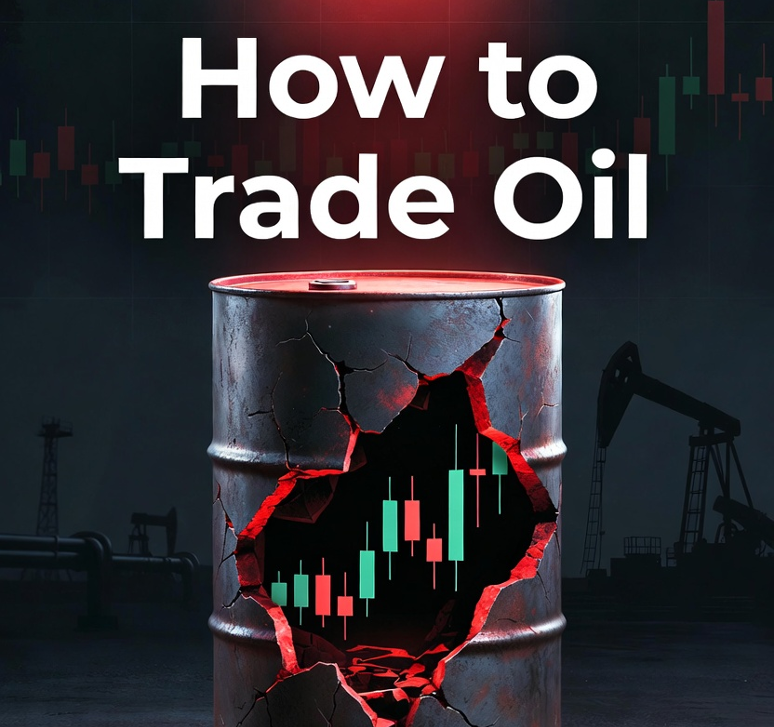
Oil Market Volatility Revives Interest in How to Trade Oil
Oil prices swing hard these days, and every spike or crash brings fresh waves of traders asking the same question: how to trade oil without getting wrecked. Geopolitical flares, OPEC decisions, inventory reports, and demand shifts from China or the US keep WTI and Brent in constant motion. Volatility creates massive opportunities for quick profits but also wipes accounts fast if you jump in blind.
I have traded crude for over a decade, through $140 barrels, negative prices, and everything in between. Oil is not like forex majors; it has its own rhythm driven by physical supply chains and macro forces. This guide covers what oil really is as a tradable asset, the main price drivers, proven strategies I use, risk rules that actually work, and common traps. Everything here is practical and ready to apply on a demo account today.
Understanding Oil as a Trading Instrument
Oil trades mainly as WTI (West Texas Intermediate) and Brent Crude. WTI is US benchmark, Brent is global. Most retail traders access them via CFDs or futures contracts, not physical barrels. CFDs let you speculate on price direction with leverage, no expiry worries like futures.
Key difference: WTI often trades at a discount or premium to Brent due to storage costs and pipeline constraints. Contango (futures higher than spot) or backwardation (opposite) affects roll yields in long-term holds. I prefer CFDs for short-term trades because they avoid rollover fees and allow tight stops.
Volatility averages higher than majors: daily ranges 2-5% common, 10%+ during events. Pip value on standard contract varies, but expect $10 per point move on 1 lot WTI CFD. Leverage 1:20-1:100 typical, so sizing matters hugely.
Key Factors Driving Oil Price Moves
Supply and demand fundamentals rule oil. OPEC+ cuts or floods production shift balance. US shale output reacts fast to price changes. Inventory reports (EIA weekly, API Tuesday) move prices 1-3% instantly. Geopolitics (Middle East tensions, sanctions) add premium or discount.
Macro overlays matter: strong dollar pressures oil, weak dollar lifts it. Recession fears crush demand, green energy transition caps long-term upside. Seasonality plays too: summer driving season lifts gasoline demand, winter heating oil spikes.
I track EIA inventories obsessively. Surprises of +2 million barrels often drop prices 2-4%, misses the opposite. Combine with USD index and risk sentiment for confluence.
Here is a quick reference table of major oil price drivers and typical impact magnitude in current conditions.
| Driver | Frequency | Typical Price Impact | Direction Influence | Best Monitoring Tool |
| OPEC+ Decisions | Quarterly + ad hoc | 5-15% | Cuts = up, increases = down | Official statements, news |
| EIA/API Inventories | Weekly | 1-5% | Build = down, draw = up | EIA.gov release, Bloomberg |
| Geopolitical Events | Unpredictable | 3-20%+ | Tensions = up, resolution = down | News wires, Twitter/X alerts |
| USD Strength | Daily | 0.5-3% inverse | Strong USD = down | DXY index chart |
| Demand (China/US) | Monthly/quarterly | 2-8% | Growth = up, slowdown = down | PMI data, refinery runs |
| Seasonality | Annual | 5-10% seasonal | Summer/winter peaks | Historical charts |
EIA/API releases remain the highest-probability short-term movers.
Practical Strategies for Trading Oil
Trend following works well in oil. Use 50/200 SMA crossover on H4/D1 for direction, enter on pullbacks to 20 EMA with RSI confirmation. Target 1:2 RR minimum.
Breakout trading shines on news. Watch EIA release: if build > forecast, short below range low, stop above high. Recent example: EIA surprise build of 4.1M barrels, WTI broke 78.20 support, entered short at 78.10, stop 78.80, target 76.00. Closed +210 points in 3 hours.
Mean reversion in ranges: Bollinger squeeze + Stochastic oversold near support = long. On Brent M30, price hit lower band at $82, Stochastic <20, entered long, target middle band. +140 points quick scalp.
Combine with volume: high volume breakouts confirm conviction. Avoid trading during low-liquidity Asian session.
Risk Management and Position Sizing
Oil volatility demands iron risk rules. Risk 0.5-1% per trade max. On $20,000 account, 1% = $200 max loss. If stop 100 points away on WTI CFD (point value $1 per 0.01 lot), max size 0.2 lots ($200 / 100 = $2/point).
Always use hard stops. News gaps in oil are brutal; I set stops beyond recent swing + ATR buffer. Never move stops to give “room” — that is gambling.
Diversify: limit oil to 20-30% portfolio exposure. Correlated assets (CAD pairs, energy stocks) amplify risk. Track margin level >300% always.
I once overexposed on WTI long during OPEC rumor, level dropped to 140% on reversal. Closed manually, limited loss to 3.5%. Without sizing discipline, stop out would have hit 25%.
Conclusion
Trading oil rewards those who respect its volatility and fundamentals. WTI and Brent move on supply shocks, inventories, geopolitics, and macro flows. Use trend, breakout, or mean reversion strategies with strict confluence. Size positions based on 0.5-1% risk, place stops beyond volatility, and monitor margin health religiously. Skip low-probability setups during quiet periods.
Success comes from preparation and patience, not chasing every spike. Demo test strategies during high-impact releases, track win rate and RR, and adjust as market regime changes. For in-depth coverage of oil specifics, contract types, key drivers, proven setups, and risk pitfalls, check this comprehensive guide: how to trade oil. It gives you the full toolkit to approach crude confidently. Stay disciplined, and oil’s wild moves can become consistent profits.